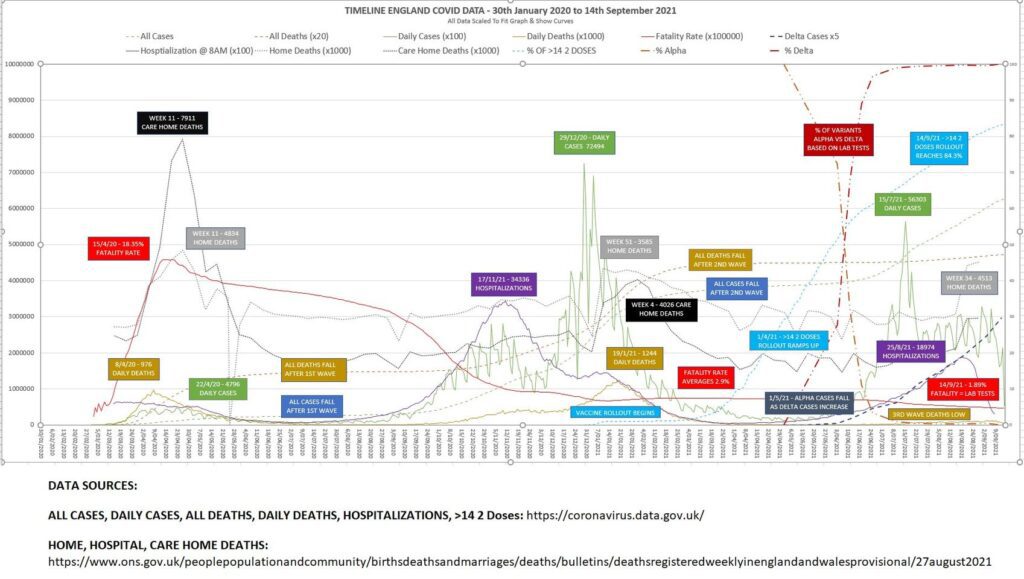
Despite of the launch of the new experimental mRNA vaccines in late December 2020, the rollout was somewhat slow to begin with. It wasn’t until early April that England reached a 10% level of the population having the first two shots. Whilst Delta started to appear in February it wasn’t until the end of March that it started to pickup. By the beginning of June it had over taken Alpha as the dominant variant and by the beginning of July Alpha was more or less gone and the Delta variant was the No.1 variant of concern. With no vaccine around Alpha’s Case Fatality rate had settled around 2% for the unvaccinated whilst when delta reached the masses it averaged approx. 0.2% across all age groups. This timeline from January 2020 to September 2021 shows a detail look of everything that happened during that time.
Initially when Public Health England started recording details about VOC-21APR092 (later rebranded to Delta), it recorded the Case Fatality Rates across all age groups up until Technical Briefing 12 release on 22nd May 2021. With little or the population Alpha’s Case Fatality rate had settled approx. 2% for the unvaccinated whilst delta started off at 0.2% across all age groups.
All Ages Case Fatality Rate

Initially the vaccine looked promising with most deaths being attributed to the unvaccinated as they were approx. 5 times more likely to die than the fully boosted with a little under 50% of the population receiving their initial first and second booster. The unvaccinated were 5.29 times more likely to die than the unvaccinated at the end of May 2021. However, this was to change over the course of the next month quite rapidly and come the beginning of the July, quite the reverse occurred to both the fully vaccinated and the unvaccinated.
Over 50’s Case Fatality Rate
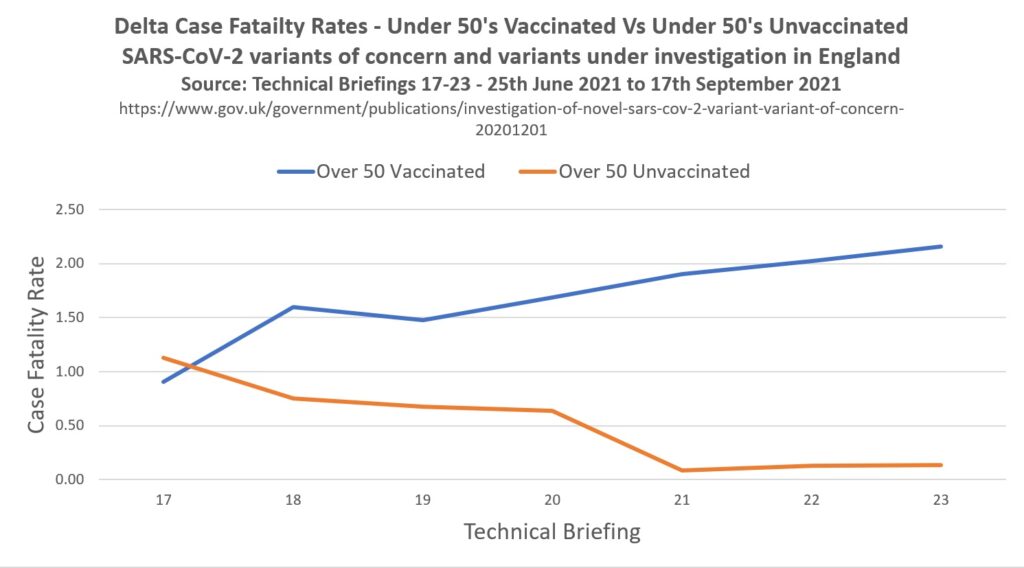
When Technical Briefing 17 was released they split the data into two age groups, the under 50’s and the 50’s and over. This gave a clearer picture of what was happening, whilst the CFR for the unvaccinated over 50’s was increasing, the CFR for the fully vaccinated was keeping steady and averaging around the 2.0% rate, the same rate as Alpha was. Yet Delta had only just got started and this would soon change quite rapidly.
Under 50’s Case Fatality Rate
Between Technical Briefing 17 & 23 we can see both the unvaccinated and fully boosted were increasing at a steady rate and unlike the Over 50’s which shows that vaccines were working, there’s no evidence suggesting they were for the under 50’s. One of the reasons why the All Ages CFR for Delta plummeted from 1.13% to 0.08% is because more and more of the under 50’s was getting infected as there are far more of them in the population than the over 50’s.

Come October 2021, Public Health England was rebranded to UK Health Security Agency and with it a whole new level of reporting came with it and has concerned me ever since I started analyzing its data in 2021. These reports broke down the age groups even further so you can see precisely who the vaccine was benefiting and those that it was doing more harm than good. You can read more about those findings here.
Sources
Public Health England – SARS-CoV-2 Variants Of Concern And Variants Under Investigation In England Week 13 2021 – Week 23 2021 : https://www.gov.uk/government/publications/investigation-of-novel-sars-cov-2-variant-variant-of-concern-20201201
Excel Spreadsheet : https://redacted.exposed/wp-content/uploads/2023/12/Public-Health-England-Technical-Briefings-13-23.xlsx
Zip File Containing All The Above : https://redacted.exposed/wp-content/uploads/2023/12/The-Rise-Of-The-Delta-Variant.zip